Paper List
1. Shang, R.*, Zhu, Z.. (2019). Harmonizing Landsat 8 and Sentinel-2: A time-series-based reflectance adjustment approach. Remote Sensing of Environment, 235, 111439.
2. Xu, M., Liu, R., Chen, J., Liu, Y., Shang, R., Ju, W., Wu, C, Huang, W.. (2019). Retrieving leaf chlorophyll content using a matrix-based vegetation index combination approach. Remote Sensing of Environment, 224, 560-73.
3. Qiu, S., Lin, Y., Shang, R.*, Zhang, J., Ma, L., Zhu, Z.*. (2019). Making Landsat time series consistent: evaluating and improving Landsat Analysis Ready Data. Remote Sensing, 11, 51.
4. Shang, R., Liu, R., Xu, M., Liu, Y., Dash, J., & Ge, Q. (2018). Determining the Start of the Growing Season from MODIS Data in the Indian Monsoon Region: Identifying Available Data in the Rainy Season and Modeling the Varied Vegetation Growth Trajectories. Remote Sensing, 10, 122.
5. Shang, R., Liu, R., Xu, M., Liu, Y., Zuo, L., & Ge, Q. (2017). The relationship between the threshold-based and the inflexion-based approaches in extraction of land surface phenology. Remote Sensing of Environment, 199, 167-170.
6. Liu, R., Shang, R., Liu, Y., & Lu, X. (2017). Global evaluation of gap-filling approaches for seasonal NDVI with considering vegetation growth trajectory, protection of key point, noise resistance and curve stability. Remote Sensing of Environment, 189, 164-179.
7. Li, W.*, Niu, Z., Shang, R.*, Qin, Y., Wang, L., & Chen, H. (2020). High-resolution mapping of forest canopy height using machine learning by coupling ICESat-2 LiDAR with Sentinel-1, Sentinel-2 and Landsat-8 data. International Journal of Applied Earth Observations and Geoinformation, 2020, 92, 102163.
Representative papers
1. Global time series interpolation (2017)
Liu, R.*, Shang, R., Liu, Y., & Lu, X. (2017). Global evaluation of gap-filling approaches for seasonal NDVI with considering vegetation growth trajectory, protection of key point, noise resistance and curve stability. Remote Sensing of Environment, 189, 164-179.
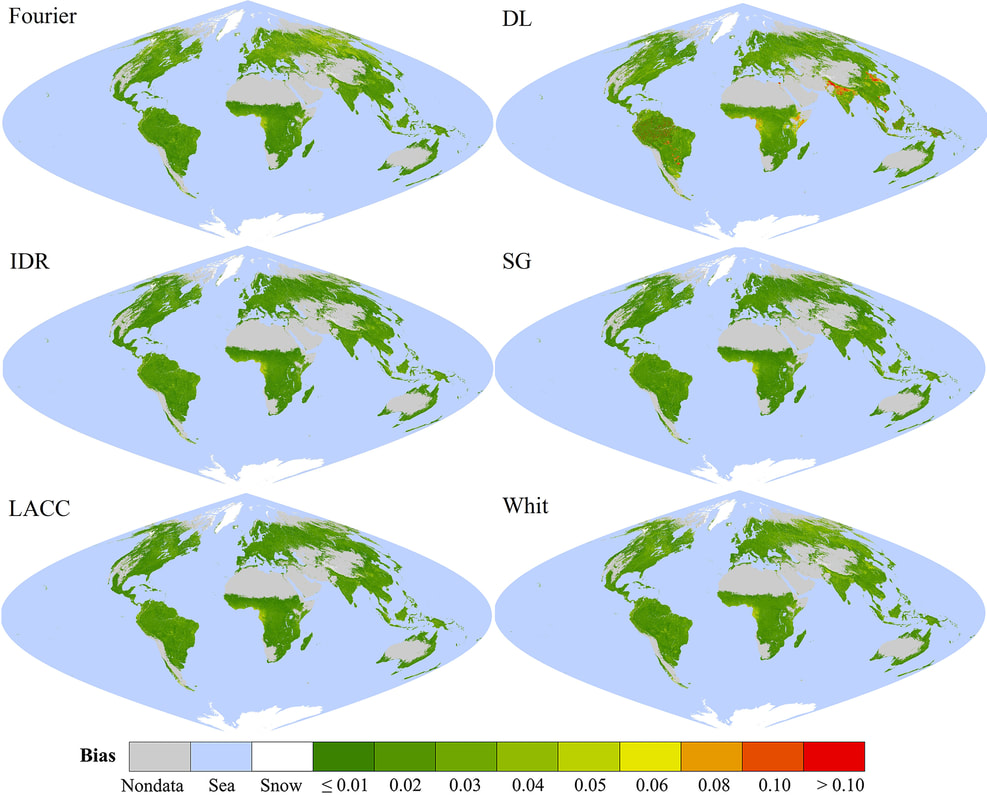
A variety of approaches are available to fill the gaps in the time series of vegetation parameters estimated from satellite observations. In this paper, a scheme considering vegetation growth trajectory, protection of key point, noise resistance and curve stability was proposed to evaluate the gap-filling approaches. Six approaches for gap filling were globally evaluated pixel-by-pixel based on a reference NDVI generated from MODIS observations during the past 15 years. The evaluated approaches include the Fourier-based approach (Fourier), the double logistic model (DL), the iterative interpolation for data reconstruction (IDR), the Whittaker smoother (Whit), the Savitzky-Golay filter (SG) and the locally adjusted cubic spline capping approach (LACC). Considering the five aspects, the ranks of the overall performance are LACC > Fourier > IDR > DL > SG > Whit. The six approaches are similar in filling the gaps and remaining the curve stability but there are large difference in protection of key points and noise resistance. The SG is sensitive to noises and the Whit is poor in protection of key points. In the monsoon regions of India, all evaluated approaches don't work well. This paper provides some new views for evaluating the gap filling approaches that will be helpful in selecting the optimal approach to reconstruct the time series of parameters for data applications.
2. Globally extracting land surface phenology (2017)
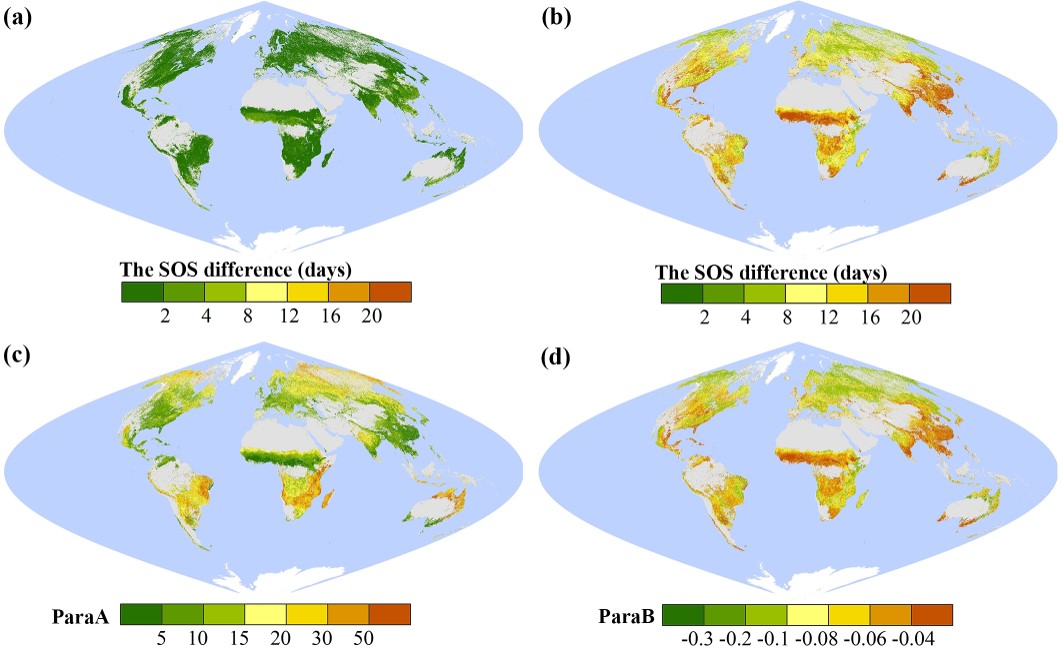
Shang, R., Liu, R.*, Xu, M., Liu, Y., Zuo, L., & Ge, Q. (2017). The relationship between the threshold-based and the inflexion-based approaches in extraction of land surface phenology. Remote Sensing of Environment, 199, 167-170.
The inflexion-based and threshold-based approaches are the two most popular approaches for extracting land surface phenology (LSP). The first approach uses inflexion point of the vegetation growth curve to determine the start-of-season (SOS) and end-of-season (EOS), while the second approach identifies SOS and EOS with a predefined percentage of vegetation growth amplitude. These two approaches have long been thought to be independent. In this letter, we investigated the relationship between the two approaches for extracting SOS. It was found that the thresholds at several key points in the inflexion-based approach are constant. The threshold at the inflexion point for SOS and EOS is 9.18% of vegetation growth amplitude. This threshold can link the SOS derived from the two approaches, which made it possible to determine the significant vegetation growth transitions for the threshold-based approach. Other thresholds for SOS retrieval, such as commonly-used 10% and 20% of vegetation growth amplitude, were also analyzed using a global reference NDVI. A high SOS difference between the two approaches indicates a slow vegetation growth.
3. Phenology product in the Indian monsoon region (2018)
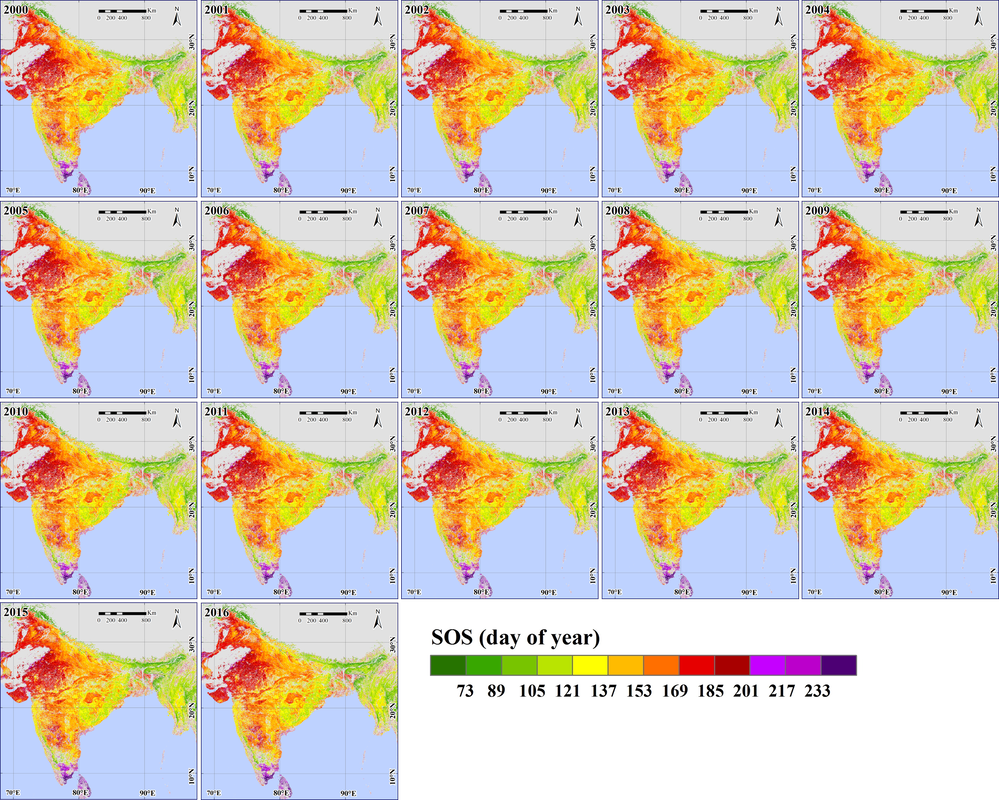
Shang, R., Liu, R.*, Xu, M., Liu, Y., Dash, J., & Ge, Q. (2018). Determining the Start of the Growing Season from MODIS Data in the Indian Monsoon Region: Identifying Available Data in the Rainy Season and Modeling the Varied Vegetation Growth Trajectories. Remote Sensing, 10, 122.
In the Indian monsoon region, frequent cloud cover in the rainy season results in less valid satellite observations during the vegetation growth period, making it difficult to extract land surface phenology (LSP). Even worse, many valid but humid observations were misidentified as clouds in the MODIS cloud mask, causing severe gaps in the LSP product. Using a refined cloud detection approach to separate clear-sky and cloudy observations, this study found that potentially valid observations during the vegetation growth period could be identified. Furthermore, the varied vegetation growth trajectories cannot be well-fitted by a global curve-fitting approach, but can be modelled by using the locally adjusted cubic-spline capping approach, which performed well for any seasonal patterns. Applying this approach, the start of growing season (SOS) was determined with 9.18% of vegetation growth amplitude between the maximum and minimum NDVI to generate the SOS product (2000–2016). The valid percentage of this regional product largely increased from 29.30% to 69.76% compared with the MCD12Q2 product, and its reliability was approximate to that of deciduous broadleaf forest in North America and Europe. This product could serve as a basis for understanding the response of terrestrial ecosystems to the changing Indian monsoon.
4. Improving Landsat ARD (2019)
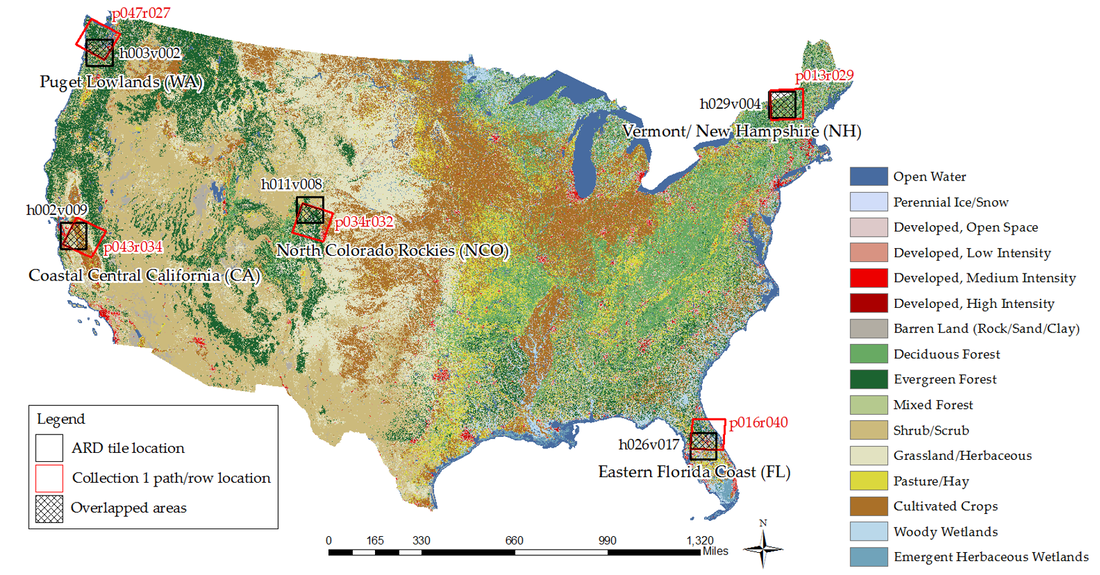
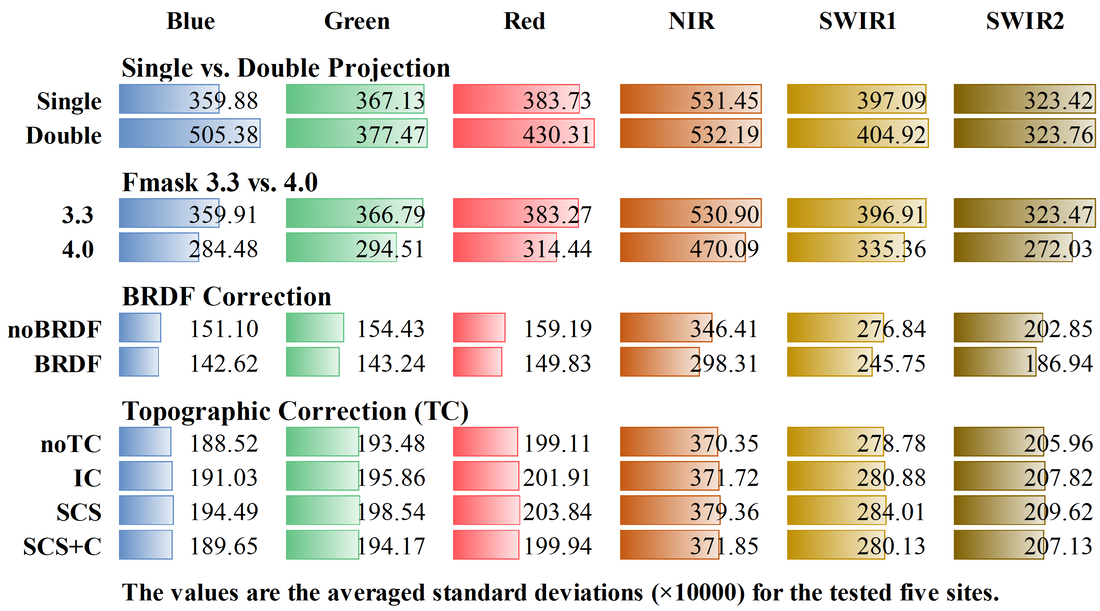
Qiu, S., Lin, Y., Shang, R.*, Zhang, J., Ma, L., Zhu, Z.*. (2019). Making Landsat time series consistent: evaluating and improving Landsat Analysis Ready Data. Remote Sensing, 11, 51.
Recently, the United States Geological Survey (USGS) has released a new dataset, called Landsat Analysis Ready Data (ARD), which is designed specifically for facilitating time series analysis. In this study, we evaluated the temporal consistency of this new dataset and recommended several processing streamlines for improving data consistency. Specifically, we examined the impacts of data resampling, cloud/cloud shadow detection, Bidirectional Reflectance Distribution Function (BRDF) correction, and topographic correction on the temporal consistency of the Landsat Time Series (LTS). We have four major observations. First, single-resampled data (ARD) are generally more consistent than double-resampled data (re-projected Collection 1 data), but the difference is very minor. Second, the improved cloud and cloud shadow detection approach (e.g., Fmask 4.0 vs. 3.3) moderately increased data consistency. Third, BRDF correction contributed the most in making LTS consistent. Finally, we corrected the topographic effects by using several widely used algorithms, including Sun-Canopy-Sensor (SCS), a semiempirical SCS (SCS+C), and Illumination Correction (IC) algorithms, however they were found to have very limited or even negative impacts on the consistency of LTS. Therefore, we recommend using Landsat ARD with the improved cloud and cloud shadow detection approach (Fmask 4.0), and with BRDF correction for routine time series analysis.
5. TRA apprach (2019)
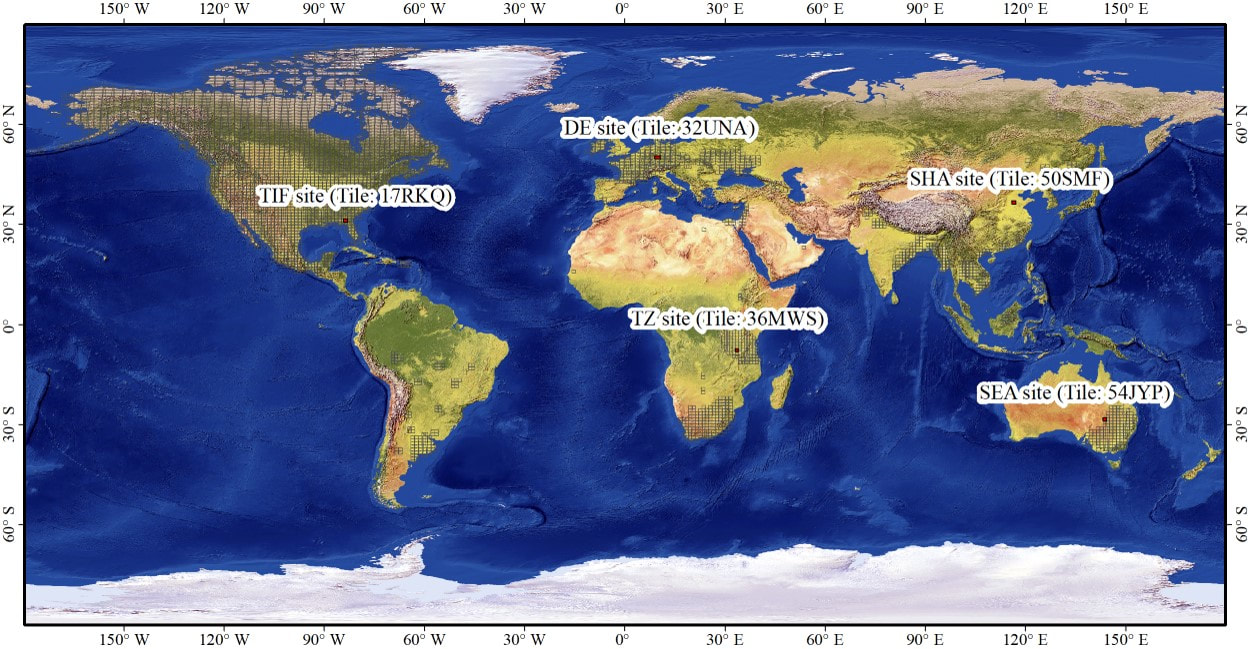
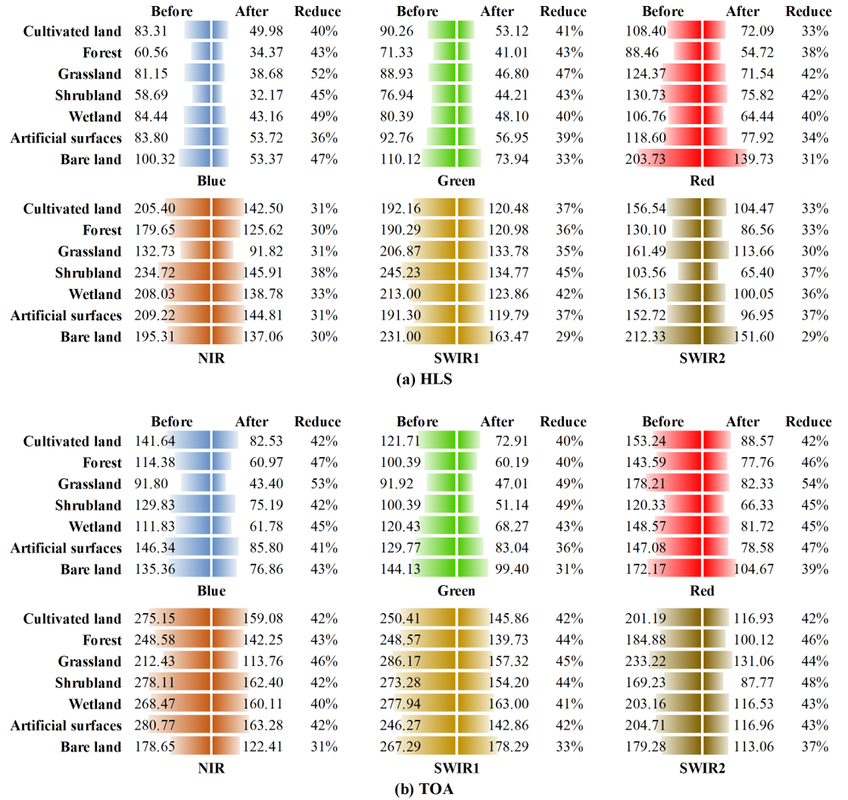
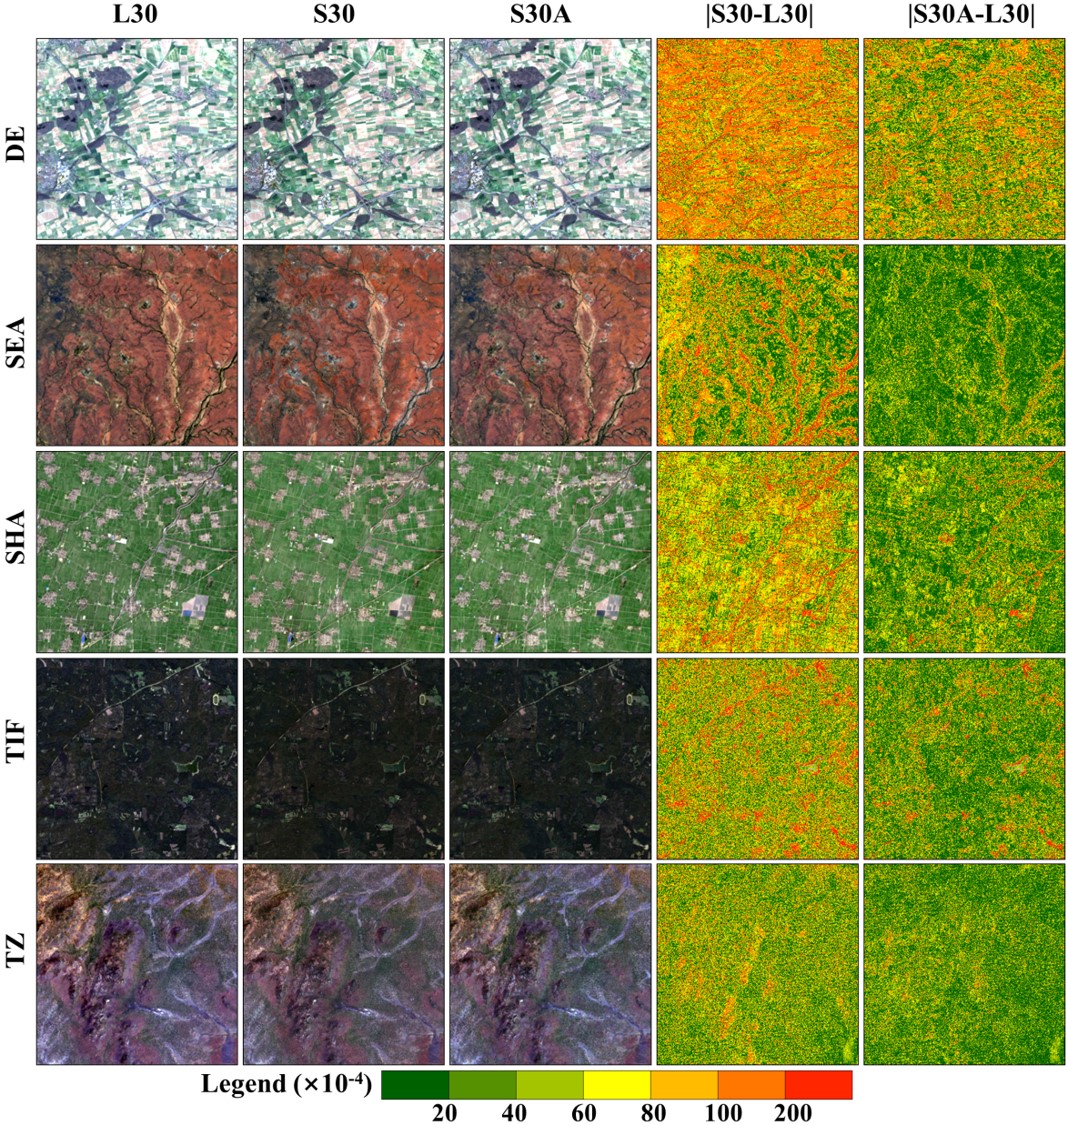
Shang, R.*, Zhu, Z.. (2019). Harmonizing Landsat 8 and Sentinel-2: A time-series-based reflectance adjustment approach. Remote Sensing of Environment, 235, 111439.
We developed a Time-series-based Reflectance Adjustment (TRA) approach for reducing the reflectance differences between Landsat 8 and Sentinel-2 observations. This TRA approach used the time series of matched Landsat 8 and Sentinel-2 observations to build linear regression models to adjust reflectance differences between the two sensors for each individual pixel and each spectral band. We evaluated this approach for the NASA harmonized Landsat and Sentinel-2 (HLS) surface reflectance product (V1.4; https://hls.gsfc.nasa.gov/data/v1.4/) and top-of-atmosphere (TOA) reflectance with approximately 4 years of temporal coverage at five Military Grid Reference System (MGRS) tiles. Using this approach, the surface reflectance difference between Landsat 8 and Sentinel-2 in the HLS product reduced 45% for the blue band, 42% for the green band, 38% for the red band, 30% for the Near Infrared (NIR) band, 37% for the Shortwave Infrared (SWIR) 1 band, and 32% for the SWIR2 band. The TRA approach also reduced TOA reflectance difference between Landsat 8 and Sentinel-2 substantially, in which the blue band reduced 46%, the green and NIR bands reduced 42%, the red band reduced 48%, and the SWIR1 and SWIR2 bands reduced 44%. If the high aerosol observations were screened, the reflectance differences in the HLS product could be further reduced by 2–4% and the TOA reflectance differences could be further reduced by 3–6% for the six spectral bands. The TRA approach has also shown good results in reserving the spatial patterns and the heterogeneity of land surface. The transformation parameters estimated from the TRA approach can be directly used for future Landsat 8 and Sentinel-2 reflectance adjustment, with slightly lower (5%) reduction of reflectance difference.